NDA Software
PSC has developed custom NDA-1 compliant software to support NDA. This software includes Peak Doctor, SNAP™ (Spectral Nondestructive Assay Platform), and Material Accountancy Software.
Peak Doctor
Peak Doctor and SNAP™ (Spectral Nondestructive Assay Platform) provide the analysis engines required to support field operations with HPGe detectors (portable NDA, soil surveys, inventories, D&D, waste retrieval etc.) as well as more complex fully automated plant systems e.g. for disposal, safeguards, nuclear criticality safety and waste sorting/segregation.
User-Configurable Analysis
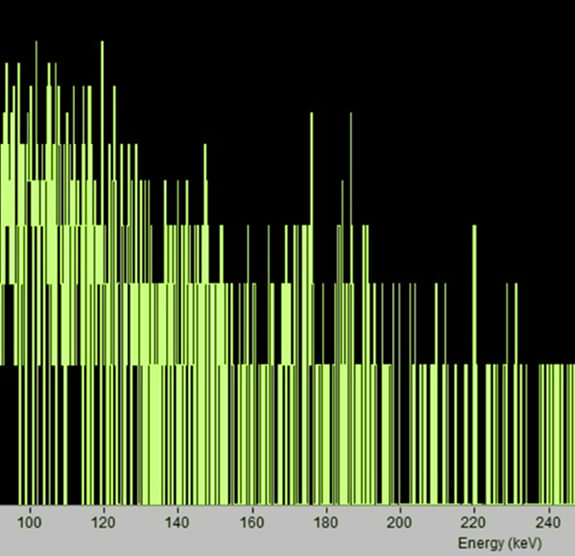
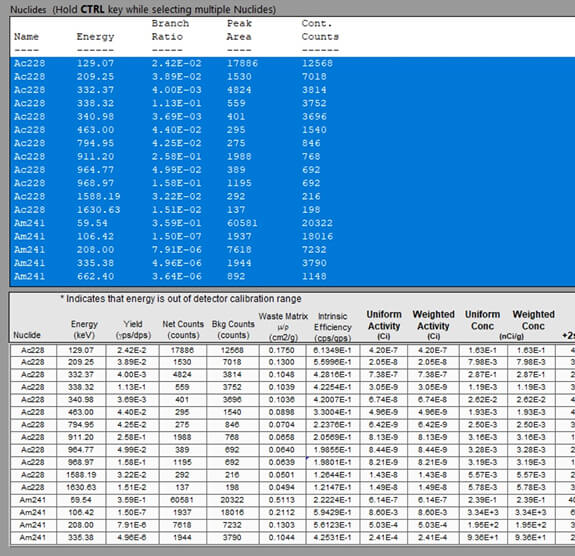
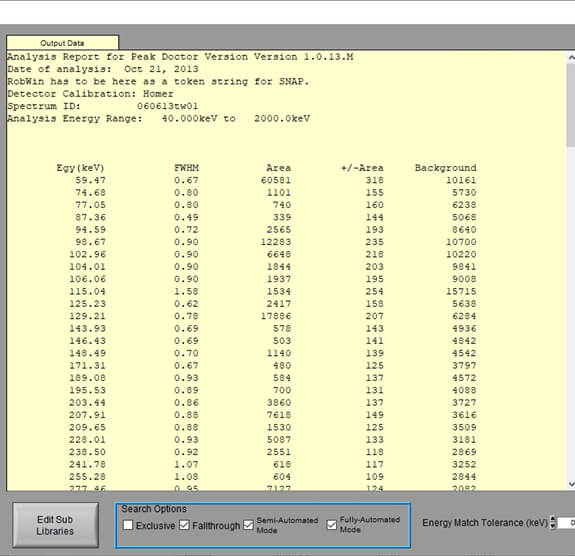
Peak Doctor software performs accurate user-configurable analysis of photopeak areas in medium- and high-resolution gamma spectroscopy applications. This analysis is required as an input to SNAP. It can be customized to any given type of detector and any given type of spectrum accounting for overlapping peaks, complex multiple regions, large step peaks, backscatter regions and Compton edges.
A continuum is fit using a series of splines between a series of junction points, or “knots”. The material type (for example plutonium, uranium) is identified in the software and the analysis proceeds using Peak Doctor’s “One Step” method (without user interaction). Detailed manual adjustments of problem spectra can be performed. For example, any peaks that are missed can be manually added and will also be fitted.
Our Material Accountancy Software provides NQA-1 compliant software to track and record fissile material quantities to conform to material accountancy which is typical to meet IAEA and other requirements.
SNAP™
SNAP™ performs corrections for attenuation (matrix, container wall, and other attenuating materials) and geometry through published algorithms using traceable calibration sources.
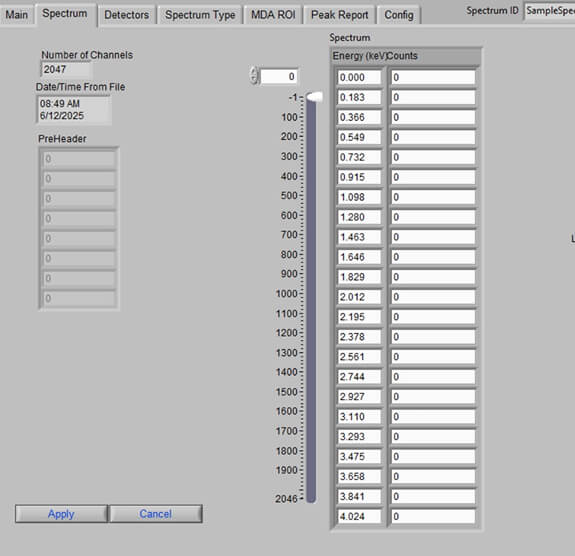
Spectrum Analysis
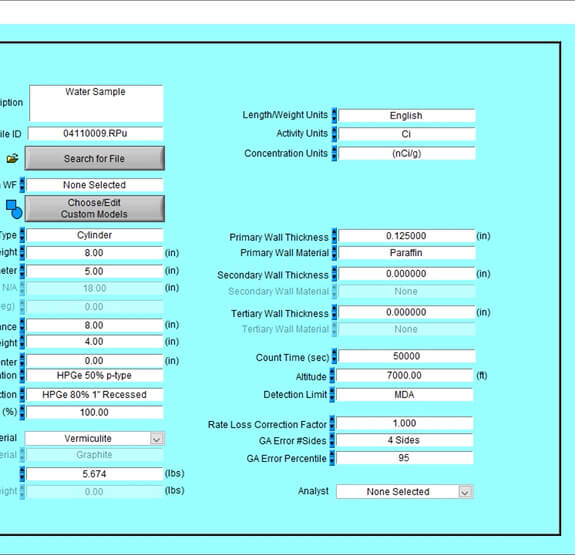
SNAP™ incorporates a series of decision points during its operation to allow the gamma spectroscopist (the analyst) to provide logical input to guide the software during the analysis of each unique spectrum. The SNAP software accounts for matrix and container wall effects, collimator / angular corrections, detector efficiency (based on calibration curves) and stand-off distance. In addition to the standard templates (supporting containers of various sizes) the user can create a custom geometry or source distribution using a “Special Modeling” mode.
Various matrix contents can also be simulated in SNAP™. A customizable materials library is used to calculate mass attenuation coefficients for typical material types encountered in field measurements, e.g. metals, soils, concrete, etc. A detailed Total Measurement Uncertainty (TMU) analysis (including errors from matrix and geometry assumptions, statistical error, and detector efficiency error) is provided in SNAP™.
Error Propagation
Error propagation is performed based on geometrical and matrix effects, counting-statistics and detector calibration uncertainty. Differential Peak Analysis (or DPA) can be performed to reduce uncertainty associated with matrix and self-shielding effects. This is particularly important in large containers with dense matrices.
A graphical differential peak analysis interface is used to view plots of relative activities at different energies. This represents a very powerful analytical tool. For each nuclide of interest, the calculated activity of each peak relative to its average activity is displayed allowing the analyst to validate, refine and improve the accuracy of the modelling approach used.